AI Product · Platform UX/UI
VestMap
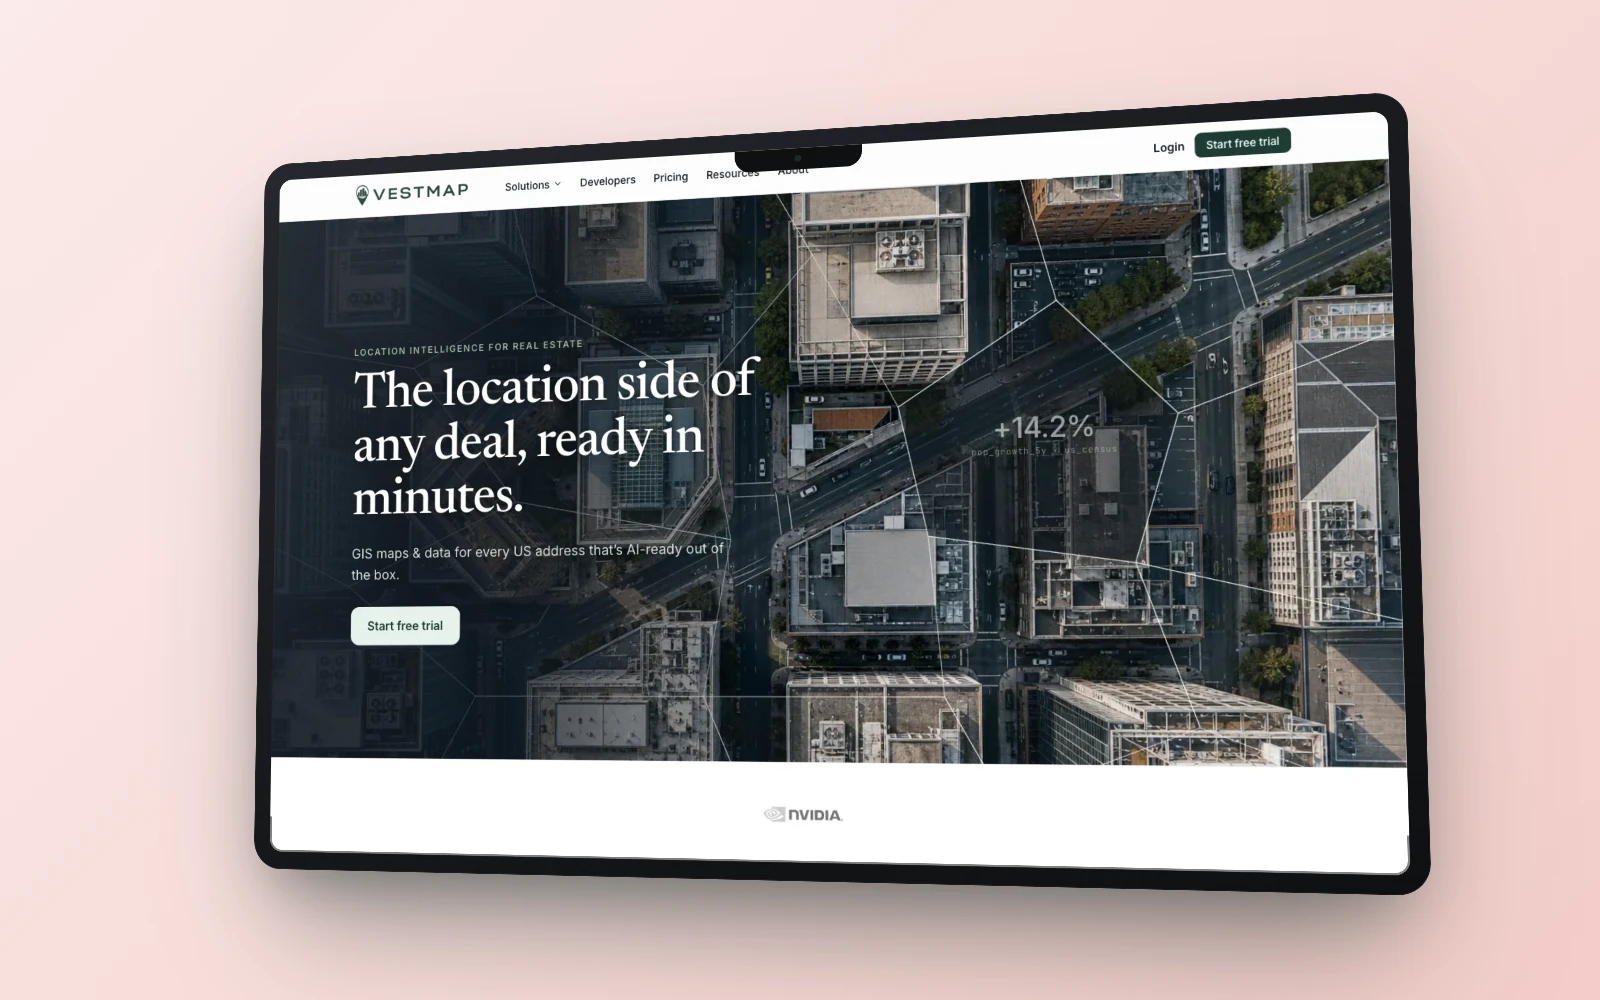
AI analysts for commercial real estate: a platform that turns any US address into an investor-grade location report in minutes.
Role
Product Design (UX/UI)
Scope
Platform Design · Figma
Team
The App Chefs: backend & AI
Year
2026
The challenge
Commercial real estate investors burned weeks on manual deal analysis, pulling demographics, competitor density, expansion trends, and crime data from a dozen disconnected sources before every decision.
VestMap needed to compress that entire workflow into one AI-driven platform. I designed the product experience in Figma so an investor-grade site-selection report feels effortless: search an address, pick parameters, get a clear report in minutes.
What I did
Designed the end-to-end platform UX/UI in Figma (from address search and parameter selection to the structured “VestMap” report), starting from the investor's real question (is this location worth the deal?), not just what data happened to exist about it.
Shaped a clean, data-dense interface that makes complex GIS and demographic data easy to scan, trust, and share: dense enough for institutional users, clear enough to hand straight to a client.
Built the design system and flows so the same report template scales from a single block group up to a full nationwide portfolio, without redesigning it every time the data model grows.
Partnered with The App Chefs, who engineered the AI agents and backend orchestrating multiple data APIs, so the interface could stay focused on clarity while the AI did the heavy lifting underneath.
How someone actually uses it
Enter any US address
The starting point for every report; no account or setup required to search.
Choose the scale
From a single block group (~1,500 people) up to a full metro: 393 nationwide. Every field is available at every scale.
Get the VestMap report
A structured, investor-grade location report, built to be scanned in minutes, not researched for weeks.
The same report format scales into a full portfolio; repeat for the next address without starting over.
Key screens
01 · Frame the right problem
A location decision took weeks of fragmented research.
Investors assembled demographics, competition and market signals across disconnected sources before they could evaluate one address.
Select a stage to inspect the thinking
Observed behavior
“Is this address worth the deal?”VestMap Agent: search, analyze, or compare
One chat-style entry point across four modes (Analyze, Compare, Discover, Research) with recent searches saved below, so a returning user never starts from zero.
Discover: map every building in a market
A radius or geography search returns thousands of buildings with unit counts and distance, filterable by beds, baths, and $/SF, built for scanning a whole submarket, not one address at a time.
Rent Advisor: every underpriced unit, ranked
20 opportunities worth +$8,128/mo surfaced automatically, each showing current vs. recommended rent, delta, and comp confidence, turning a spreadsheet audit into a prioritized action list.
My Reports: every VestMap, saved and reusable
Past reports for an address stay on file with remaining Pro Searches tracked alongside them, so a team can revisit a location without burning a new search.
The full report, one address at a time
Demographics, Income, House Price Index, Schools, Crime, Expansion, and Rent all live in one sidebar-driven report, so an investor scrolls once instead of opening a dozen sources.
Income, down to the block
Median household income at block, tract, ZIP, county, state, and national levels side by side, so a $117K block inside a $79K county reads as signal, not noise.
The exportable report: proof, not just a dashboard
Every analysis can generate a shareable PDF: the same numbers from the live dashboard, packaged into a clean, client-ready document in one click.
Real numbers, real users.
0k+
Census block groups covered nationwide
0k+
Census tracts covered nationwide
0,143
US counties covered, coast to coast
0
Metro areas (MSAs) available at full scale